Making (some) sense of data storage and presentation in Excel
By Anna Vasylytsya. Anna is in the process of completing her Master’s in Public Policy with an emphasis on research methods. She is excited about the role that data can play in improving people’s lives!
At the MERL Tech Conference, I attended a session called “The 20 skills that solve 80% of M&E problems” presented by Dr. Leslie Sage of DevResults. I was struck by the practical recommendations Leslie shared that can benefit anyone that uses Excel to store and/or present data.
I boiled down the 20 skills presented in the session into three key takeaways, below.
1. Discerning between data storage and data presentation
Data storage and data presentation serve two different functions and never the two shall meet. In other words, data storage is never data presentation.
Proper data storage should not contain merged cells, subheadings, color used to denote information, different data types within cells (numbers and letters), more than one piece of data in a cell (such as disaggregations). Additionally, in proper data storage, columns should be the variables and rows as the observations or vice versa. Poor data storage practices need to be avoided because they mean that you cannot use Excel’s features to present the data.
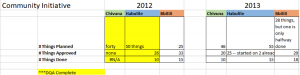
A common example of poor data storage:
One of the reasons that this is not good data storage is because you are not able to manipulate this data using Excel’s features. If you needed this data in a different format or you wanted to visualize it, you would have to do this manually, which would be time consuming.
Here is the same data presented in a “good” storage format:
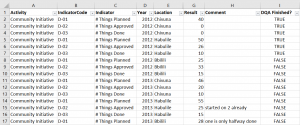
Data stored this way may not look as pretty, but it is not meant to be presented or read in within the sheet. This is an example of good data storage because each unique observation gets a new row in the spreadsheet. When you properly store data, it is easy for Excel to aggregate the data and summarize it in a pivot table, for example.
2. Use Excel’s features to organize and clean data
You do not have to use precious time to organize or clean data manually. Here are a few recommendations on Excel’s data organization and cleaning features:
- To join to cells that have text into one cell, use the concatenate function.
- To split text from one cell into different cells, use the text to columns
- To clean text data, use Excel’s functions: trim, lower, upper, proper, right, left, and len.
- To move data from rows into columns or columns into rows, use Excel’s transpose feature.
- There is a feature to remove duplicates from the data.
- Create a macro to automate simple repetitive steps in Excel.
- Insert data validation in an excel spreadsheet if you are sending a data spreadsheet to implementers or partners to fill out.
- This restricts the type of data or values that can be entered in certain parts of the spreadsheet.
- It also saves you time from having to clean the data after you receive it.
- Use the vlookup function in Excel in your offline version to look up a Unique ID
- Funders or donors normally require that data is anonymized if it is made public. While not the best option for anonymizing data, you can use Excel if you haven’t been provided with specific tools or processes.
- You can create an “online” anonymized version that contains a Unique ID and an “offline version” (not public) containing the ID and Personally Identifiable Information (PII). Then, if you needed to answer a question about a Unique ID, for example, your survey was missing data and you needed to go back and collect it, you can use vlookup to find a particular record.
3. Use Excel’s features to visualize data
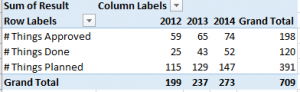
One of the reasons to organize data properly so that you can use Excel’s Pivot Table feature.
Here is an example of a pivot table made from the data in the good data storage example above (which took about a minute to make):
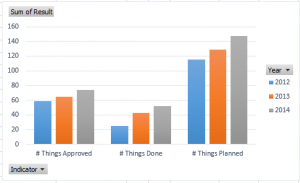
Using the pivot table, you can then use Excel’s Create a Chart Feature to quickly make a bar graph:
In the Future
I have fallen prey to poor data storage practices in the past. Now that I have learned these best practices and features of Excel, I know I will improve my data storage and presentation practices. Also, now that I have shared them with you; I hope that you will too!
Please note that in this post I did not discuss how Excel’s functions or features work or how to use them. There are plenty of resources online to help you discover and explore them. Some helpful links have been included as a start. Additionally, the data presented here are fictional and created purely for demonstration purposes.
You might also like
-
Join the AI and African Evaluation Working Group Meet ‘n’ Mix Session on May 7!
-
Hands on with GenAI: predictions and observations from The MERL Tech Initiative and Oxford Policy Management’s ICT4D Training Day
-
When Might We Use AI for Evaluation Purposes? A discussion with New Directions for Evaluation (NDE) authors
-
A visual guide to today’s GenAI landscape