Qualitative Coding: From Low Tech to High Tech Options
by Daniel Ramirez-Raftree, MERL Tech volunteer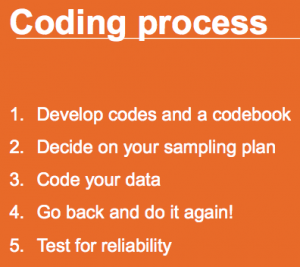
In their MERL Tech DC session on qualitative coding, Charles Guedenet and Anne Laesecke from IREX together with Danielle de Garcia of Social Impact offered an introduction to the qualitative coding process followed by a hands-on demonstration on using Excel and Dedoose for coding and analyzing text.
They began by defining content analysis as any effort to make sense of qualitative data that takes a volume of qualitative material and attempts to identify core consistencies and meanings. More concretely, it is a research method that uses a set of procedures to make valid inferences from text. They also shared their thoughts on what makes for a good qualitative coding method.
Their belief is that: it should
- consider what is already known about the topic being explored
- be logically grounded in this existing knowledge
- use existing knowledge as a basis for looking for evidence in the text being analyzed
With this definition laid out, they moved to a discussion about the coding process where they elaborated on four general steps:
- develop codes and a codebook
- decide on a sampling plan
- code your data
- go back and do it again!
- test for reliability
Developing codes and a codebook is important for establishing consistency in the coding process, especially if there will be multiple coders working on the data. A good way to start developing these codes is to consider what is already known. For example, you can think about literature that exists on the subject you’re studying. Alternatively, you can simply turn to the research questions the project seeks to answer and use them as a guide for creating your codes. Beyond this, it is also useful to go through the content and think about what you notice as you read. Once a codebook is created, it will lend stability and some measure of objectivity to the project.
The next important issue is the question of sampling. When determining sample size, though a larger sample will yield more robust results, one must of course consider the practical constraints of time, cost and effort. Does the benefit of higher quality results justify the additional investment? Fortunately, the type of data will often inform sampling. For example, if there is a huge volume of data, it may be impossible to analyze it all, but it would be prudent to sample at least 30% of it. On the other hand, usually interview and focus group data will all be analyzed, because otherwise the effort of obtaining the data would have gone to waste.
Regarding sampling method, session leads highlighted two strategies that produce sound results. One is systematic random sampling and the other is quota sampling–a method employed to ensure that the proportions of demographic group data are fairly represented.
Once these key decisions have been made, the actual coding can begin. Here, all coders should work from the same codebook and apply the codes to the same unit of analysis. Typical units of analysis are: single words, themes, sentences, paragraphs, and items (such as articles, images, books, or programs). Consistency is essential. A way to test the level of consistency is to have a 10% overlap in the content each coder analyzes and aim for 80% agreement between their coding of that content. If the coders are not applying the same codes to the same units this could either mean that they are not trained properly or that the code book needs to be altered.
Along a similar vein, the fourth step in the coding process is to test for reliability. Challenges in producing stable and consistent results in coding could include: using a unit of analysis that is too large for a simple code to be reliably applied, coding themes or concepts that are ambiguous, and coding nonverbal items. For each of these, the central problem is that the units of analysis leave too much room for subjective interpretation that can introduce bias. Having a detailed codebook can help to mitigate against this.
After giving an overview of the coding process, the session leads suggested a few possible strategies for data visualization. One is to use a word tree, which helps one look at the context in which a word appears. Another is a bubble chart, which is useful if one has descriptive data and demographic information. Thirdly, correlation maps are good for showing what sorts of relationships exist among the data. The leads suggested visiting the website stephanieevergreen.com/blog for more ideas about data visualization.
Finally, the leads covered low-tech and high-tech options for coding. On the low-tech end of the spectrum, paper and pen get the job done. They are useful when there are few data sources to analyze, when the coding is simple, and when there is limited tech literacy among the coders. Next up the scale is Excel, which works when there are few data sources and when the coders are familiar with Excel. Then the session leads closed their presentation with a demonstration of Dedoose, which is a qualitative coding tool with advanced capabilities like the capacity to code audio and video files and specialized visualization tools. In addition to Dedoose, the presenters mentioned Nvivo and Atlas as other available qualitative coding software.
Despite the range of qualitative content available for analysis, there are a few core principles that can help ensure that it is analyzed well, these include consistency and disciplined methodology. And if qualitative coding will be an ongoing part of your organization’s operations, there are several options for specialized software that are available for you to explore. [Click here for links and additional resources from the session.]
You might also like
-
Hands on with GenAI: predictions and observations from The MERL Tech Initiative and Oxford Policy Management’s ICT4D Training Day
-
When Might We Use AI for Evaluation Purposes? A discussion with New Directions for Evaluation (NDE) authors
-
A visual guide to today’s GenAI landscape
-
Register now for the NLP-CoP Ethics and Governance Working Group Meeting on April 18th