
We Need More Design Thinking in Monitoring, Evaluation, Research & Learning. Here’s how.

Confession # 1: I still count on my fingers. Numbers swim in front of my eyes and dashboards make me break into a cold sweat. As a result, Monitoring & Evaluation (M&E) has often felt like something I’m subjected to rather than an intrinsic part of my work as a digital service designer. This is needless to say, problematic, but I’m fairly sure the feeling is shared by many working on the implementation side of digital development.
I think a lot about the negative impact this blind spot has on my work, and this post includes some reflections on how designers can do better at engaging with M&E colleagues and activities. But sitting in a meeting recently, staring at rows and rows of KPIs, another, more collective, blind spot hit me: shouldn’t we also be applying design thinking in M&E?
Confession # 2: As you hopefully know, design is not a silver bullet. Design thinking and techniques give the illusion of simplifying complexity, but no design tool will ever override the fact that humans, and the systems we operate within, are messy and unpredictable.
Ironically, I’ve found this realization freeing – it has allowed me to see design not as a series of strict processes applicable only to tech, but as a looser ‘framework for thinking’, based around three key pillars – empathy, common sense, and creativity. These principles can be applied in any arena where we are producing something – in order to improve usability and outcomes, but also the process followed to get there.
Bringing Design into MERL
There are a few design approaches that I believe could usefully be applied to MERL activities, especially to make outputs more reliable and more usable, but also to make the sometimes painful aspects of working on data and measurement in cross-functional teams more pleasant for everyone.
Personas and user research
User personas are simply ‘character’ sketches that aim to represent the most important commonalities and diversities in a target audience. They help us on the journey of creating something that will be useful, but also enjoyable, and are an important decision-making aid at all stages of design and deployment.
MERL practitioners are designers too: their ‘products’ tell stories, and they also provide a ‘service’, for example, in the shape of allowing team members to access relevant data via a dashboard. I would love to see MERL practitioners think more critically about their audience, and sketch out representative personas, from the beginning of M&E design processes, to make sure that their outputs – be they dashboards, learning briefs, or conference workshops – cater to the diverse needs of their audience.
For example, MERL Tech Initiative (MTI) has developed personas to help us sense-check ideas for events and learning products to support the NLP-Community of Practice, as well as for mapping out the ecosystems in which the audience is operating. Similarly, during the development of capacity-building products and guidance on ethical AI, we’ve conducted Key Informant Interviews, sitting with different stakeholders to unpack their needs and level of expertise before we commit to one specific approach.
Key questions that MERL practitioners could ask more often include:
- Who am I making this learning product for?
- What is their goal in relation to this topic?
- Where are they most likely to be when consuming this data or learning product?
- What barriers to consuming or absorbing this information might they face?
- What’s their preferred format or form of communication?
- What accessibility challenges should we take into account, for example, numeric, linguistic, or visual?
This might sound obvious (a big part of design thinking is common sense, after all) but it’s a step that we often neglect – even when we’re using human-centered thinking in other areas of work.
Data Bloat & Minimum Viable Data
When we say “we don’t have enough data to build a clear picture” what we often actually mean is “we don’t have the right data” or even “we have the right data, but we don’t have the skills or time to make sense of it.” And yet, we persist in compiling long lists of KPIs, lengthy reports, and complex dashboards that often don’t get used (or used properly) by the teams they’re intended for.
During a design sprint, designers facilitate activities that help answer the question “What is the Minimum Viable Product we can build to test our idea?”. M&E teams could similarly ask “What is the Minimum Viable Data we need to learn something useful?”. With digital products, the temptation is to see any and all data as useful – which of course, it can be, because even the smallest data point tells us a story, or provides an intriguing clue, about user behavior.
But arguably, our time and energy would be better spent extracting meaning from smaller amounts of data to begin with, rather than diluting our efforts across multiple possible rabbit holes. This also helps us to follow principles of “data minimization” as required by data privacy regulations and by responsible data policies in many organizations.
Of course, some of the most powerful stakeholders who influence our approach to data are funders. Anyone who’s worked in digital development for long enough knows that hard evidence is, well, hard to generate, and as a result we tend to over-collect. Engaging funders in conversations about Minimum Viable Data could be a good way to move away from this paradigm.
Usability testing and iterating
Finally, building on our work trying to map out the realities and needs of our MERL product-users, we should factor in more time for testing and iterating. This could be useful both as part of the data analysis phase of the M&E lifecycle and also during the dissemination phase.
This could include prototyping MERL products before they’re developed (for example, a paper prototype of a dashboard), or A-B testing a dissemination approach (for example, should we create a 30-page evaluation report, document vs a 30-minute audio guide or a 7-minute podcast?). Another design technique to break out of the box a little is a technique like Crazy 8s, which requires participants to come up with 8 no-holds-barred ideas in a short time.
This type of design thinking and testing would be important for evaluation reports as well, to better understand how decision-makers want to consume information and learning, in what format that learning is more likely to lead to evidence-based decision-making, and how to communicate better to achieve the change we are seeking.
Even if there is only time to test a product after it’s been developed, it’s not too late. At The MERL Tech Initiative, we are increasingly factoring in time to talk to members of our intended audiences to gather their feedback on learning tools we’ve produced – providing clients with ‘bonus’ strategic suggestions to maximize the chances of the tools’ use. Through this simple step, not only have we gathered actionable feedback (much of which we’re able to incorporate), but we’ve also unearthed unexpected insights into the teams’ wider needs related to knowledge management or development processes, that are of strategic value to our partners.

Whilst we acknowledge that digital products need multiple iterations as we figure out what works and what doesn’t, we rarely give MERL products the same grace. We need to see more time and money dedicated to tweaking and improving knowledge management products, too.
Bringing MERL into Design
Stop me if this is familiar: Your team receives funding to launch a digital product, for example, a mobile website, in an attempt to effect measurable change on a specific social issue. The funder may or may not have stringent M&E requirements (I see you, fellow logframe survivors). Either way, you have a decent sense of what you’re supposed to achieve, and why. The next question is how, which is where the design cycle kicks in – discovery, definition, build, test, iterate, etc. Meanwhile, M&E colleagues go away and work on a measurement framework and approach, often tied to a Theory of Change. It’s presented back to the team. Interventions are launched. Dashboards are built. Impact surveys are rolled out.
And that’s when the fun starts. Wait, we’re not actually capturing the data we need to measure our indicators? You’ve defined this KPI as what now? We’re measuring something this product doesn’t really do? What do you mean this dashboard is incomprehensible? I’m (somewhat) exaggerating, but if any of that seems familiar, there are two things we could do to improve.
Talk to each other!
A lot of this could be avoided if designers, M&E teams, and data scientists saw each other as allies. Part of the friction between these roles lies in the fact that:
- designers and developers tend to be most interested in, and excited by, the micro-world of performance data (how well is my product doing at driving users through this experience I’ve crafted for them?)
- M&E practitioners often operate in the macro-world of impact data (are these multiple interventions actually having the desired effect?) and reporting to donors (what figures can I share that prove we’ve delivered?).
A useful project step could be identifying and acknowledging where our priorities and interests diverge, but also where they do (or could!) converge.
So, if you’re the developer or designer, when you run a design sprint – make sure the M&E folks are actively involved. Doing internal testing? Make them a priority stakeholder. Creating an M&E framework? Collaborate with product designers, to understand more about what can and could be measured and learned, not just what should. M&E teams should ideally be as knowledgeable about the intricacies of your product (whether digital or not) as you are – and vice versa.
Design a ‘data wireframe’
Finally, to my fellow designers – it’s time to acknowledge that we are not designing one, but two, products when we design a digital tool. We get hung up on the user-facing experience, be it a chatbot, website, or IVR service, because let’s face it, that’s the fun part. What we tend to forget is to design its “data-shadow” – the trail of data users create when they interact with it. There are some exceptions, for example when designing an online course, but this is the bit that gets left behind.
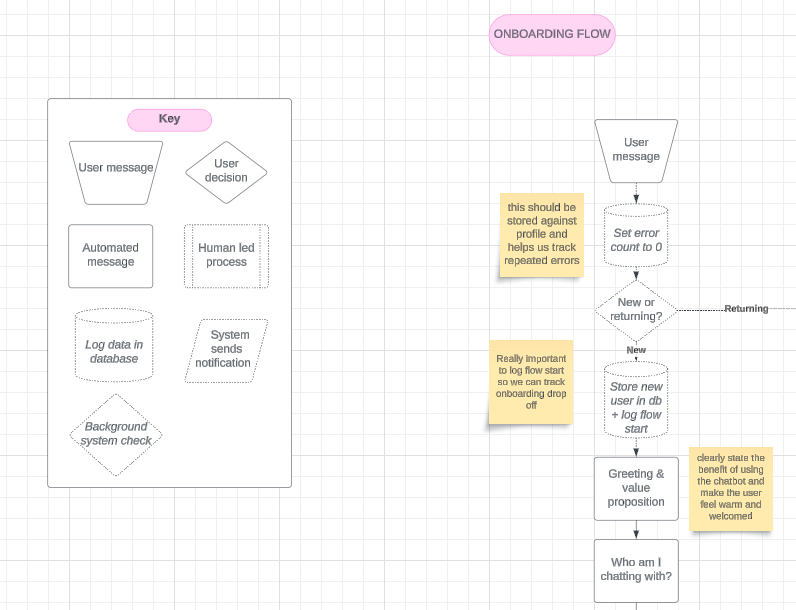
Example of a digital product wireframe incorporating data capturing
While designers are well-versed in writing requirements that reflect the needs of end-users or system administrators, we should also be writing user stories that reflect the needs of M&E teams (or indeed, anyone interested in impact and performance data). In addition to delivering user-facing wireframes and mockups, we should be designing “data-wireframes,” and working with engineers and data scientists to figure out if each data point is even measurable. If not, we’ll need to work together to design a proxy and ensure this is reflected in the M&E framework.
*
Like all things in the development and humanitarian sectors, our ability to experiment with approaches like the ones outlined above depends significantly on our funders’ willingness to support (read: pay for) more iterative, collaborative approaches. All too often, we are supposed to deliver data that demonstrates specific, pre-ordained “impact”, rather than working together cross-functionally to experiment and learn together. M&E teams can often bear the brunt of this, as if they are the ones standing in judgment of our products’ success, when in fact we should be allies from the start.
I hold my hands up that I don’t always practice what I preach, for all the usual reasons that undermine the best intentions (forgetfulness, expediency, personal relationships…). Writing this is a way of holding myself accountable to ‘do better’ – and I hope a few things here resonate with my colleagues in design and MERL.
But please, don’t judge me if, after all your efforts, I still can’t interpret your bar chart.
Leave a Reply
You might also like
-
Event: What are the resources we need to navigate AI, gender and MERL?
-
Event recap: The Humanitarian AI Countdown and humanitarian knowledge production with Kristin Sandvik
-
Research Digest 2: State of AI Adoption and Competencies for Evaluators for Made in Africa AI in MERL
-
Bias in, bias out? How we’re understanding more about gender bias in LLMs
“Like all things in the development and humanitarian sectors, our ability to experiment with approaches like the ones outlined above depends significantly on our funders’ willingness to support (read: pay for) more iterative, collaborative approaches.” This resonates deeply with myownexperience.
Reality is that, funders’ openness to innovation and iterative approaches would go a long way to ensure simplified, user oriented and relevant MERL solutions but the reality on the ground is far from this.
Regarding Designers or Developers working hand in hand with MERL team from start of projects, MERL Team members are usually brought mid way or at the latter stages or project implementation because most PM’s and project cost structure failed to account for putting MERL systems in place at the commencement of projects. Things might have changed for learning organizations but many local organizations are still far limited resource wise to let best practice guide their work.
Thanks for your comment, and totally agreed. It’s important to keep dreaming – maybe one day we’ll be heard ><
Thank you so much for this article. I have been developing an article ‘in my head’ asking M&E managers “Where Is the Data?”. I think you’ve added to my thoughts here. M&E managers often do not have the data to report performance or simply put, report what the donor wants to see/curious about. Hence, they should be more involved in the design, so that the storytelling or visualization can start to form in their head.
Excellent piece. Thank you!
This is interesting should be applied to my MERL tasks
We start applying the concept in our Monitoring and Evaluation tasks.