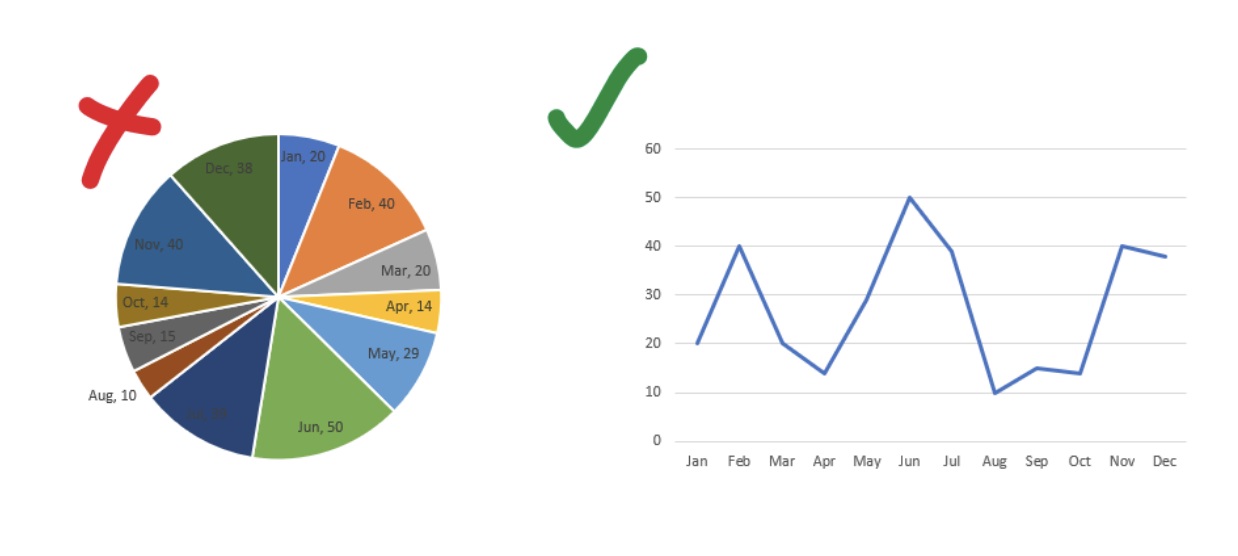
Three Problems — and a Solution — for Data Viz in MERL and ICT4D
Guest post by Amanda Makulec, MPH, Data Visualization Society Operations Director Just about everyone I know in the ICT4D and MERL communities has interacted with, presented, or created a chart, dashboard, infographic, or other data visualization. We’ve also all seen charts that mislead, confuse, or otherwise fall short of making information more accessible. The goal […]
