What’s the Deal with Data — Bridging the Data Divide in Development
Written by Ambika Samarthya-Howard, Head of Communications, Praekelt.org. This post was originally published on March 26, 2018, on Medium.
Working on communications at Praekelt.org, I have had the opportunity to see first-hand the power of sharing stories in driving impact and changing attitudes. Over the past month I’ve attended several unrelated events all touching on data, evaluation, and digital development which have reaffirmed the importance of finding common ground to share and communicate data we value.

Storytelling and Data
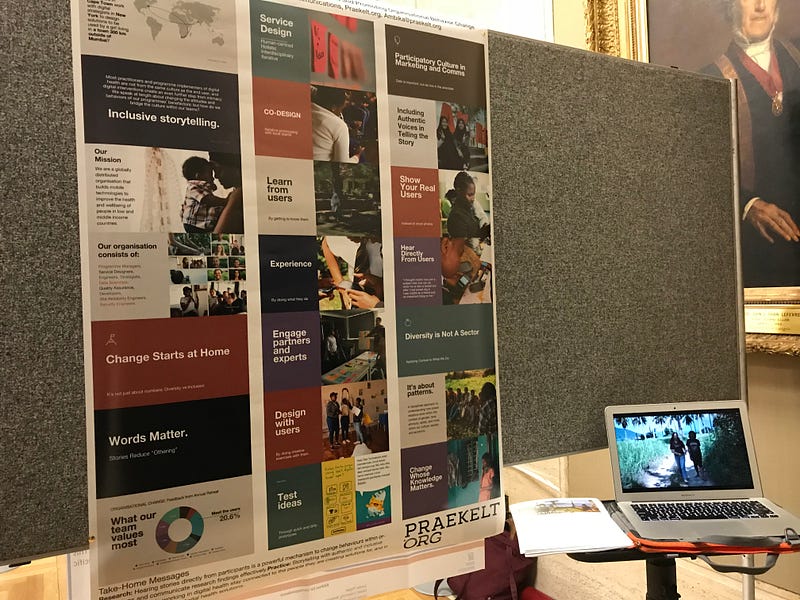
I recently presented a poster on “Storytelling for Organisational Change” at the University of London’s Behavior Change Conference. Our current evaluations at Praekelt draw on work by the center, which is a game-changer in the field. But I didn’t submit an abstract on our agile, experimental investigations: I was sharing information about how I was using films and our storytelling to create change within the organisation.
After my abstract was accepted, I realized I had to present my findings as a poster. For many practitioners (like myself) we really have no idea what a poster entails. Thankfully I got advice from academics and support from design colleagues to translate my videos, photos, and storytelling deck into a visual form I could pin up. When the printers in New York told me “this is a really great poster”, I started picking up the hint that it was atypical.
Once I arrived at the poster hall at UCL, I could see why. Nearly, if not all, of the posters in the room had charts and numbers and graphs — lots and lots of data points. On the other hand, my poster had almost no “data”. It was colorful, and showed a few engaging images, the story of our human-centered design process, and was accompanied by videos playing on my laptop alongside the booth. It was definitely a departure from the “research” around the room.
This divide between research and practice showed up many times through the conference. For starters, this year, attendees were asked to choose a sticker label based on whether they were in research/ academics or programme/ practitioners. Many of the sessions talked about how to bridge the divide and make research more accessible to practitioners, and take learnings from programme creators to academia.
Thankfully for me, the tight knit group of practitioners felt solace and connection to my chart-less poster, and perhaps the academics a bit of a relief at the visuals as well: we went home with one of the best poster awards at the conference.
Data Parties and Cliques

The London conference was only the beginning of when I became aware of the conversations around the data divide in digital development. “Why are we even using the word data? Does anyone else value it? Does anyone else know what it means?” Anthony Waddell, Chief Innovation Officer of IBI, provocatively put out there at a breakout session at USAID’s Digital Development Forum in Washington. The conference gathered organisations around the United States working in digital development, asking them to consider key points around the evolution of digital development in the next decade — access, inclusivity, AI, and, of course, the role of data.
This specific break-out session was sharing best practices of using and understanding data within organisations, especially amongst programmes teams and country office colleagues. It also expanded to sharing with beneficiaries, governments, and donors. We questioned whose data mattered, why we were valuing data, and how to get other people to care.
Samhir Vasdev, the advisor for Digital Development at IREX, spoke on the panel about MIT’s initiatives and their Data Culture Lab, which shared exercises to help people understand data. He talked about throwing data parties where teams could learn and understand that what they were creating was data, too. The gatherings allow people to explore the data they produce, but perhaps did not get a chance to interrogate. The real purpose is to understand what new knowledge their own data tells them, or what further questions the data challenges them to explore. “Data parties a great way to encourage teams to explore their data and transform it into insights or questions that they can use directly in their programs.”
Understanding data can be empowering. But being shown the road forward doesn’t necessarily means that’s the road participants can or will take. As Vasdev noted, “ “Exercises like this come with their own risks. In some cases, when working with data together with beneficiaries who themselves produced that information, they might begin demanding results or action from their data. You have to be prepared to manage these expectations or connect them with resources to enable meaningful action.” One can imagine the frustration if participants saw their data leading to the need for a new clinic, yet a clinic never got built.
Big Data, Bias, and M&E
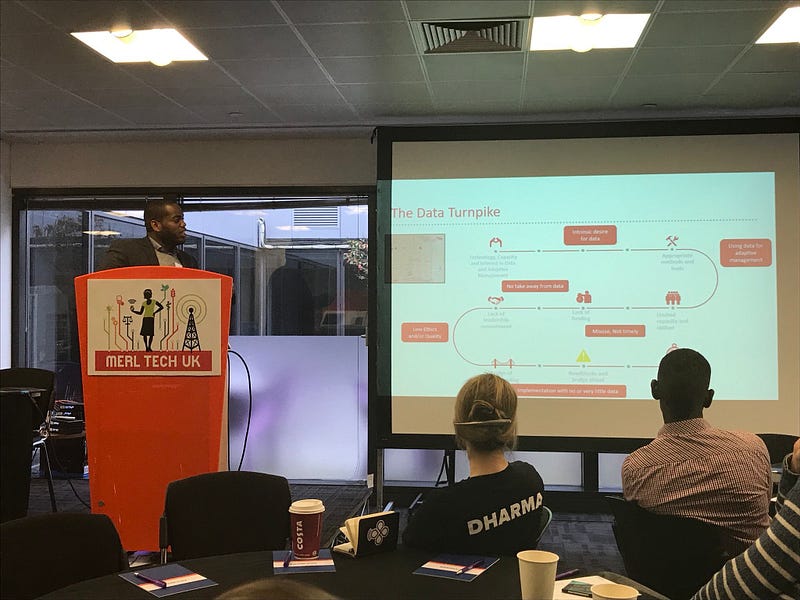
Opening the MERL (Monitoring, Evaluation, Research, and Learning) Tech Conference in London, Andre Clark, Effectiveness and Learning Adviser at Bond, spoke about the increasing importance of data in development in his keynote. Many of the voices in the room resonated with the trends and concerns I’ve observed over the last month. Is data the answer? How is it the answer? André Clarke’s keynote at MERL Tech
“The tool is not going to solve your problem,” one speaker said during the infamous off-the-record Fail Fest where attendees present on their failures to learn from each other’s mistakes. The speaker shared examples of a new reporting initiative which hadn’t panned out as expected. She noted that “we initially thought tech would help us work faster and more efficiently, but now we are clearly seeing the importance of quality data over timely data”. Although digital data may be better and faster, that does not mean it’s solving the original problem.
In using data to evaluate problems, we have to make sure we are under no illusions that we are actually dealing with core issues at hand. For examples, during my talk on Social Network Analysis we discussed both the opportunities and challenges of using the quantitative process in M&E. The conference consistently emphasized the importance of slower, and deeper processes as opposed to faster, and shorter ones driven by technology.
This holds true for how data is used in M&E practices. For example, I attended a heated debate on the role of “big data” in M&E and whether the convergence was inevitable. As one speaker mentioned, “if you close your eyes and forget the issue at hand is big data, you could feel like it was about any other tool used in M&E”. The problems around data collection, bias, inaccessibility, language, and tools were there in M&E regardless of big data or small data.
Other core issues raised were power dynamics, inclusivity, and the fact that technology is made by people and therefore it is not neutral. As Anahi Ayala Iacucci, Senior Director of Humanitarian Programs at Internews, said explicitly “we are biased, and so we are building biased tools.” In her presentation, she talked about how technology mediates and alters human relationships. If we take the slower and deeper approach we will have an ability to really explore biases and understand the value and complications of data.
“Evaluators don’t understand data, and then managers and public don’t understand evaluation talk,” Maliha Khan of Daira said, bringing it back to my original concerns about translation and bridging gaps in the space. Many of the sessions sought to address this problem, a nice example being Cooper Smith’s Kuunika project in Malawi that used local visual illustrations to accompany their survey questions on tablets. Another speaker pushed for us to move into the measurement space, as opposed to monitoring, which has the potential to be a page we can all agree on.
As someone who feels responsible for not only communicating our work externally, but sharing knowledge amongst our programmes internally, where did all this leave me? I think I’ll take my direction from Anna Maria Petruccelli, Data Analyst at Comic Relief, who spoke about how rather than organisations committing to being data-driven, they could be committed to being data-informed.
To go even further with this advice, at Praekelt we make the distinction between data-driven and evidence-driven, where the latter acknowledges the need to attend to research design and emphasize quality, not just quantity. Evidence encompasses the use of data but includes the idea that not all data are equal, that when interpreting data we attend to both the source of data and research design.
I feel confident that turning our data into knowledge, regardless of how we choose to use it and being aware of how bias informs the way we do, can be the first step forward on a unified journey. I also think this new path forward will leverage the power of storytelling to make data accessible, and organisations better informed. It’s a road less traveled, yes, but hopefully that will make all the difference.
If you are interested in joining this conversation, we encourage you to submit to the first ever MERL Tech Jozi. Abstracts due March 31st.
You might also like
-
New paper: Exploring Emerging AI as Subject and Object in Democracy-Focused Evaluation
-
Podcast: Assessing evidence on the effectiveness of humanitarian AI use cases with Humanitarian AI Today
-
New brief: Artificial intelligence in the humanitarian sector
-
REvaluation week podcast episode: “Does AI really save work in evaluation?”
